What is the Parabolic SAR indicator?
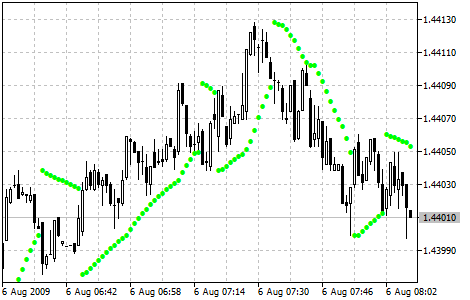
The Parabolic Stop and Reverse (SAR) is a technical analysis indicator that is used to determine the direction and strength of a trend, as well as to signal potential trend reversals. The SAR is calculated by plotting dots on a chart that indicate where the price is likely to stop and reverse direction. The indicator is called ”parabolic” because the dots form a parabolic shape as the trend continues.
How is it used by traders?
Traders often use the Parabolic SAR to identify potential buying and selling opportunities. For example, if the dots are below the price, it may indicate that the security is in an uptrend, while dots above the price may suggest that it is in a downtrend. Additionally, traders can watch for a reversal of the dots, where they change from below the price to above the price or vice versa. This may signal a potential trend reversal and provide an opportunity to enter or exit a trade.
How can I add Parabolic SAR to a chart in MT4 or MT5?
To add the Parabolic SAR to a chart in MetaTrader 4 (MT4) or MetaTrader 5 (MT5), follow these steps:
- Open the chart for the currency pair, stock, or other instrument that you want to analyze.
- Click on the ”Insert” menu at the top of the chart and select ”Indicators” from the drop-down list.
- In the ”Indicators” window, scroll down until you find the ”Parabolic SAR” and then double-click on it to add it to the chart.
- The Parabolic SAR will appear on the chart as a series of dots plotted above or below the price.
- You can customize the appearance of the Parabolic SAR by right-clicking on it and selecting ”Properties” from the context menu. This will open the ”Parabolic SAR” properties window, where you can change the color, line style, and other settings for the indicator.
- Once you have customized the Parabolic SAR to your liking, click ”OK” to apply the changes and close the properties window. The updated Parabolic SAR will be displayed on the chart.