What is the Moving Average of Oscillator?
The Moving Average of Oscillator (MAO) is a technical analysis tool that traders use to identify changes in market momentum and trend strength. It is a variation of the Moving Average Convergence Divergence (MACD) indicator, which uses moving averages to identify market trends and potential entry and exit points for trades. The MAO is calculated by subtracting the 26-period moving average of the MACD line from the 9-period moving average of the MACD line.
How is it used by traders?
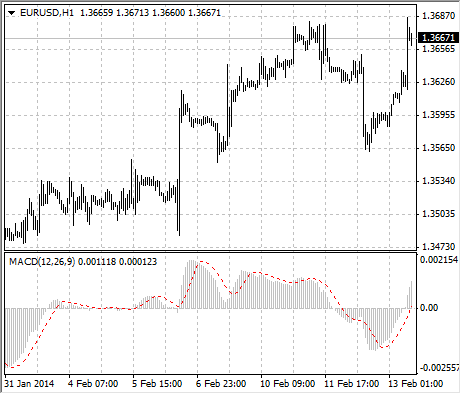
Traders typically use the Moving Average of Oscillator to identify changes in market momentum and trend strength. The MAO is displayed as a histogram below the main price chart and consists of a single line that fluctuates above and below a zero line. The direction and magnitude of the MAO line can provide insight into the strength and direction of the underlying trend. For example, if the MAO line is rising, this may indicate that the trend is gaining momentum and that the market is bullish. On the other hand, if the MAO line is falling, this may indicate that the trend is losing momentum and that the market is bearish.
How can I add the Moving Average of Oscillator to a chart in MT4 or MT5?
To add the Moving Average of Oscillator to a chart in MetaTrader 4 (MT4) or MetaTrader 5 (MT5), follow these steps:
- Open the chart for the currency pair, stock, or other instrument that you want to analyze.
- Click on the ”Insert” menu at the top of the chart and select ”Indicators” from the drop-down list.
- In the ”Indicators” window, scroll down until you find the ”Moving Average of Oscillator” and then double-click on it to add it to the chart.
- The Moving Average of Oscillator will appear on the chart as a histogram below the main price chart.
- You can customize the appearance of the Moving Average of Oscillator by right-clicking on it and selecting ”Properties” from the context menu. This will open the ”Moving Average of Oscillator” properties window, where you can change the color, line style, and other settings for the indicator.
- Once you have customized the Moving Average of Oscillator to your liking, click ”OK” to apply the changes and close the properties window. The updated Moving Average of Oscillator will be displayed on the chart.