What is the Double Exponential Moving Average (DEMA)?
The Double Exponential Moving Average (DEMA) is a technical analysis indicator that is used to smooth out price fluctuations and reduce the lag inherent in traditional moving averages. The DEMA is a type of weighted moving average that places greater weight on recent prices in order to reduce the lag and provide a more responsive indicator. It is calculated by applying an exponential moving average (EMA) to the price data, and then applying another EMA to the result of the first EMA.
How is it used by traders?
Traders typically use the DEMA to identify potential buying and selling opportunities in the financial markets. The DEMA is a trend-following indicator that can be used to confirm the strength of a trend or to identify potential trend reversals. For example, if the DEMA is rising, this may indicate that the uptrend is gaining strength, while a falling DEMA may suggest that the trend is losing momentum. Traders can also use the DEMA to identify potential support and resistance levels and to generate buy and sell signals.
How can I add the DEMA to a chart in MT4 or MT5?
To add the DEMA to a chart in MetaTrader 4 (MT4) or MetaTrader 5 (MT5), follow these steps:
- Open the chart for the currency pair, stock, or other instrument that you want to analyze.
- Click on the ”Insert” menu at the top of the chart and select ”Indicators” from the drop-down list.
- In the ”Indicators” window, scroll down until you find the ”Double Exponential Moving Average” and then double-click on it to add it to the chart.
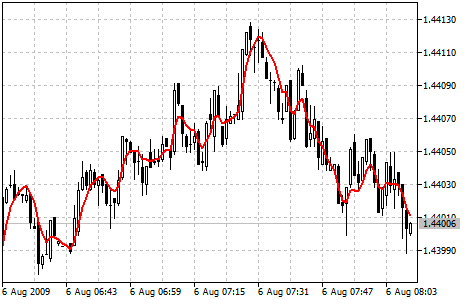
- The DEMA will appear on the chart as a separate window below the main price chart.
- You can customize the appearance of the DEMA by right-clicking on it and selecting ”Properties” from the context menu. This will open the ”Double Exponential Moving Average” properties window, where you can change the color, line style, and other settings for the indicator.
- Once you have customized the DEMA to your liking, click ”OK” to apply the changes and close the properties window. The updated DEMA will be displayed on the chart.