What is the DeMarker Indicator?
The DeMarker Indicator is a technical analysis tool that traders use to identify potential buying and selling opportunities in the financial markets. It was developed by Tom DeMark, a well-known trader and author of several books on technical analysis and trading. The DeMarker Indicator is a momentum-based oscillator that measures the relative strength of a security’s recent price gains and losses. It is similar to other oscillators, such as the Relative Strength Index (RSI), but is calculated using different formulas and parameters.
How is it used by traders?
Traders typically use the DeMarker Indicator to identify potential buying and selling opportunities based on overbought and oversold conditions. For example, if the DeMarker Indicator is above a certain threshold, the security may be considered overbought and may be due for a pullback or correction. On the other hand, if the DeMarker Indicator is below a certain threshold, the security may be considered oversold and may be due for a bounce or rally. Traders can also use the DeMarker Indicator to confirm the strength of a trend or to identify potential trend reversals. For example, a rising DeMarker Indicator may indicate that a uptrend is gaining strength, while a falling DeMarker Indicator may suggest that the trend is losing momentum.
How can I add the DeMarker Indicator to a chart in MT4 or MT5?
To add the DeMarker Indicator to a chart in MetaTrader 4 (MT4) or MetaTrader 5 (MT5), follow these steps:
- Open the chart for the currency pair, stock, or other instrument that you want to analyze.
- Click on the ”Insert” menu at the top of the chart and select ”Indicators” from the drop-down list.
- In the ”Indicators” window, scroll down until you find the ”DeMarker” and then double-click on it to add it to the chart.
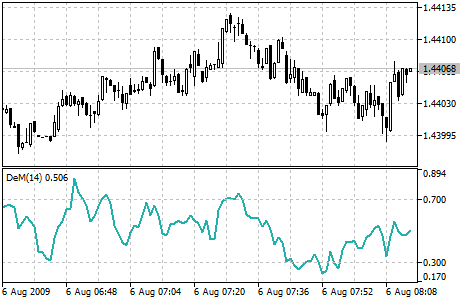
- The DeMarker Indicator will appear on the chart as a separate window below the main price chart.
- You can customize the appearance of the DeMarker Indicator by right-clicking on it and selecting ”Properties” from the context menu. This will open the ”DeMarker” properties window, where you can change the color, line style, and other settings for the indicator.
- Once you have customized the DeMarker Indicator to your liking, click ”OK” to apply the changes and close the properties window. The updated DeMarker Indicator will be displayed on the chart.