
The Bullish Flag pattern, and how to use it
The bullish flag is a chart pattern that is formed by an upward sloping resistance level and a horizontal support level. This pattern is created when the price of an asset is held in check by an upward sloping resistance level, but the support level remains horizontal. The bullish flag is a continuation pattern, which means that it is typically seen as a bullish sign and indicates that the asset’s price is likely to continue rising.
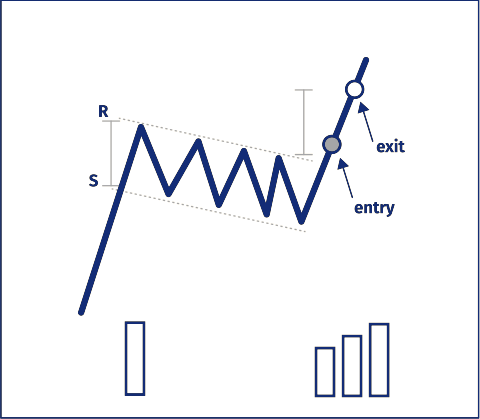
To form a bullish flag, the asset’s price will typically make a series of higher lows and test the resistance level several times before breaking through. Once the price breaks through the resistance level, it is likely to continue rising, as traders will likely enter into long positions and push the price higher.
One of the key characteristics of the bullish flag is that the trading volume tends to decrease as the pattern progresses. This is because the upward sloping resistance level acts as a barrier, preventing the price from breaking through and causing traders to become less active. However, once the price does break through the resistance level, trading volume tends to increase as traders enter into long positions and push the price higher.
In order to trade the bullish flag pattern, traders should look for the following characteristics:
- An upward sloping resistance level: This is a level at which the asset’s price has consistently struggled to break through in the past.
- A horizontal support level: This is a level at which the asset’s price has consistently found support in the past.
- Decreasing trading volume: As the pattern progresses and the price continues to test the resistance level, trading volume should decrease.
- A breakout: Once the price breaks through the resistance level, traders should enter into long positions and expect the price to continue rising.
It is important to note that the bullish flag is a bullish pattern, but it is not a guarantee that the asset’s price will rise. As with any trading strategy, it is important to use risk management techniques and to always be aware of the potential for losses.