What is the Average True Range (ATR)?
The Average True Range (ATR) is a technical analysis indicator that measures the volatility of a financial instrument. It is typically used to identify potential entry and exit points for trades, as well as to confirm the strength of a trend. The ATR is calculated by taking the average of the true range over a given period of time. The true range is the greatest of the following three values: the current high minus the current low, the absolute value of the current high minus the previous close, and the absolute value of the current low minus the previous close.
How is it used by traders?
Traders typically use the ATR to identify potential entry and exit points for trades based on the volatility of a financial instrument. For example, if the ATR is high, it may indicate that the instrument is experiencing a high degree of volatility and is likely to continue moving in a particular direction. In this case, a trader may consider entering a trade in the direction of the trend. On the other hand, if the ATR is low, it may indicate that the instrument is experiencing low volatility and may be range-bound. In this case, a trader may choose to wait for the volatility to increase before entering a trade.
How can I add the ATR to a chart in MT4 or MT5?
To add the Average True Range (ATR) to a chart in MetaTrader 4 (MT4) or MetaTrader 5 (MT5), follow these steps:
- Open the chart for the currency pair, stock, or other instrument that you want to analyze.
- Click on the ”Insert” menu at the top of the chart and select ”Indicators” from the drop-down list.
- In the ”Indicators” window, scroll down until you find the ”Average True Range” and then double-click on it to add it to the chart.
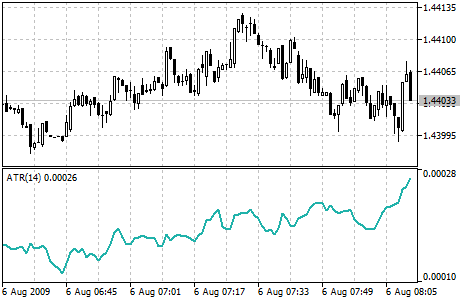
- The ATR will appear on the chart as a separate window below the main price chart.
- You can customize the appearance of the ATR by right-clicking on it and selecting ”Properties” from the context menu. This will open the ”Average True Range” properties window, where you can change the color, line style, and other settings for the indicator.
- Once you have customized the ATR to your liking, click ”OK” to apply the changes and close the properties window. The updated ATR will be displayed on the chart.