What is the Accumulation/Distribution Indicator?
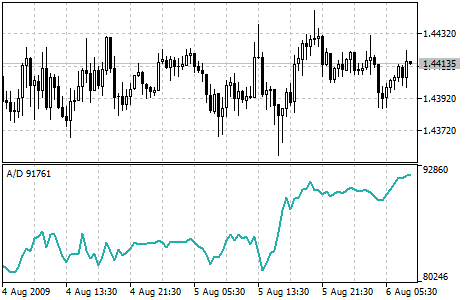
The Accumulation/Distribution Indicator is a technical analysis tool that traders use to identify buying and selling pressure in the markets. It is calculated using the volume traded for a particular security and the price change over a given period of time. The Accumulation/Distribution Indicator is displayed as a line below the main price chart and is used to identify potential buying and selling opportunities based on changes in market sentiment.
How is it used by traders?
Traders typically use the Accumulation/Distribution Indicator to identify potential buying and selling opportunities based on changes in market sentiment. If the Accumulation/Distribution Indicator is rising, this may be an indication that the security is being accumulated by buyers, which could signal a potential uptrend. On the other hand, if the Accumulation/Distribution Indicator is falling, this may be an indication that the security is being distributed by sellers, which could signal a potential downtrend. Traders can use the Accumulation/Distribution Indicator in conjunction with other technical indicators to confirm the strength of a trend or to identify potential entry and exit points for trades.
How can I add the Accumulation/Distribution Indicator to a chart in MT4 or MT5?
To add the Accumulation/Distribution Indicator to a chart in MetaTrader 4 (MT4) or MetaTrader 5 (MT5), follow these steps:
- Open the chart for the currency pair, stock, or other instrument that you want to analyze.
- Click on the ”Insert” menu at the top of the chart and select ”Indicators” from the drop-down list.
- In the ”Indicators” window, scroll down until you find the ”Accumulation/Distribution” and then double-click on it to add it to the chart.
- The Accumulation/Distribution Indicator will appear on the chart as a line below the main price chart.
- You can customize the appearance of the Accumulation/Distribution Indicator by right-clicking on it and selecting ”Properties” from the context menu. This will open the ”Accumulation/Distribution” properties window, where you can change the color, line style, and other settings for the indicator.
- Once you have customized the Accumulation/Distribution Indicator to your liking, click ”OK” to apply the changes and close the properties window. The updated Accumulation/Distribution Indicator will be displayed on the chart.