What are Fractals?
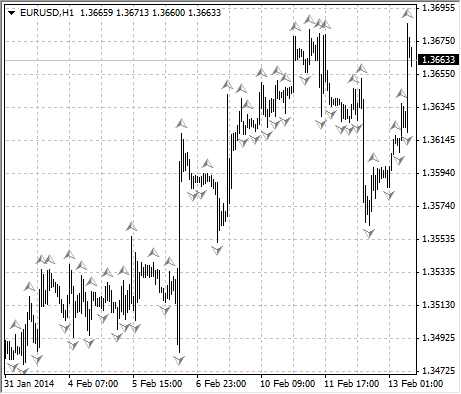
Fractals are a concept in mathematics and geometry that refers to a geometric shape or pattern that can be divided into smaller parts, each of which is a reduced-size copy of the whole. Fractals are often used in technical analysis to identify repeating patterns and trends in financial markets. In the context of trading, fractals are a series of five or more candlesticks or bars that form a pattern with a distinct high and low. The pattern is considered a fractal when the middle bar has a higher high and lower low than the two bars on either side of it.
How are they used by traders?
Traders typically use fractals to identify potential entry and exit points for trades based on repeating patterns and trends in the markets. Fractals can be used to identify support and resistance levels, as well as potential trend reversals. For example, if a downtrend is forming and a fractal pattern emerges with a higher high and lower low than the surrounding bars, this may be an indication that the trend is about to reverse and move upwards. Traders can use fractals in conjunction with other technical indicators to confirm the strength of a trend or potential entry and exit points for trades.
How can I add Fractals to a chart in MT4 or MT5?
To add Fractals to a chart in MetaTrader 4 (MT4) or MetaTrader 5 (MT5), follow these steps:
- Open the chart for the currency pair, stock, or other instrument that you want to analyze.
- Click on the ”Insert” menu at the top of the chart and select ”Indicators” from the drop-down list.
- In the ”Indicators” window, scroll down until you find the ”Fractals” and then double-click on it to add it to the chart.
- Fractals will appear on the chart as arrows pointing upwards for bullish fractals and downwards for bearish fractals.
- You can customize the appearance of the Fractals by right-clicking on it and selecting ”Properties” from the context menu. This will open the ”Fractals” properties window, where you can change the color, line style, and other settings for the indicator.
- Once you have customized the Fractals to your liking, click ”OK” to apply the changes and close the properties window. The updated Fractals will be displayed on the chart.