What are Bollinger Bands?
Bollinger Bands are a technical analysis tool that traders use to identify potential buying and selling opportunities in the financial markets. The Bollinger Bands are composed of a moving average and two bands that are placed above and below the moving average. The bands are typically set two standard deviations above and below the moving average, but this can be customized depending on the trader’s preferences and the specific market conditions.
How are they used by traders?
Traders typically use Bollinger Bands to identify potential buying and selling opportunities based on overbought and oversold conditions. For example, if the price of a stock is approaching the upper band, it may be considered overbought and may be due for a pullback or correction. On the other hand, if the price is approaching the lower band, it may be considered oversold and may be due for a bounce or rally. Traders can also use Bollinger Bands to confirm the strength of a trend or to identify potential trend reversals. For example, if the bands are widening, it may indicate that the market is becoming more volatile and that a trend reversal is possible.
How can I add Bollinger Bands to a chart in MT4 or MT5?
To add Bollinger Bands to a chart in MetaTrader 4 (MT4) or MetaTrader 5 (MT5), follow these steps:
- Open the chart for the currency pair, stock, or other instrument that you want to analyze.
- Click on the ”Insert” menu at the top of the chart and select ”Indicators” from the drop-down list.
- In the ”Indicators” window, scroll down until you find the ”Bollinger Bands” and then double-click on it to add it to the chart.
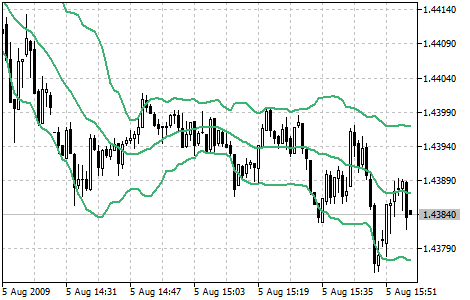
- Bollinger Bands will appear on the chart as three lines above and below the main price chart.
- You can customize the appearance of Bollinger Bands by right-clicking on it and selecting ”Properties” from the context menu. This will open the ”Bollinger Bands” properties window, where you can change the color, line style, and other settings for the indicator.
- Once you have customized Bollinger Bands to your liking, click ”OK” to apply the changes and close the properties window. The updated Bollinger Bands will be displayed on the chart.