August 10, 2021 15:10:36
After two back-to back bumper NFP reports, it’s the turn of the other part of the Fed’s mandate – inflation – to occupy our minds next. Will the July US CPI data be cresting and show signs of easing? Or are inflationary pressures more persistent and sticky than the Fed believe, forcing a shift in their tapering timeline? This would mean a continuation in the dollar bid from Friday’s employment report.
The numbers due out tomorrow are set to see the monthly reading at 0.5% in July, down from the prior 0.9%. This would push the yearly rate lower, but consensus still sees it remaining above 5%. There is a lot of uncertainty around analyst estimates with base effects now likely to exert some downward pressure on y/y rates.
But reopening effects should be evident and really, it is this impact which is crucial for Fed policy going forward. We note Fed Vice Chair Clarida, the most dovish senior FOMC official aside from Chair Powell, who recently said inflation is more persistent and broad-based and has swung in favour of tapering later this year.
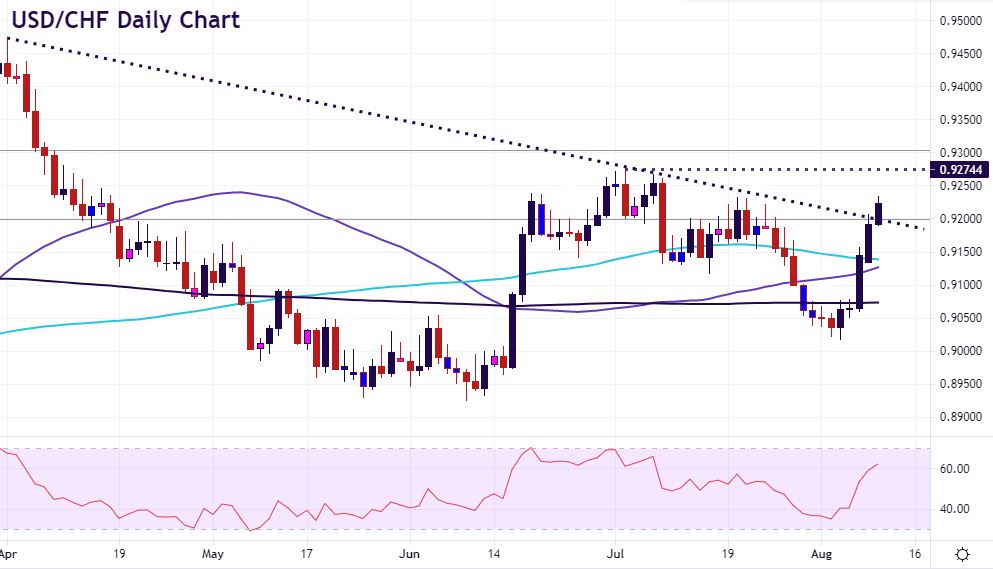
USD/CHF above trendline resistance
We were asked recently why try and guess where prices will go before a major risk event. But studying charts and technical analysis can give us an idea as to where prices may get to as history very often repeats itself. This means an asset will regularly move to previous levels of support and resistance below and above the current market. (For an excellent recent example – see Monday’s flash crash low in Gold.)
USD/CHF has rebounded nicely after dropping below the 200-day SMA at the start of this month. We are now on our fifth straight day of gains and have pushed above the 50-day and 100-day SMAs with the former set to cross above the latter. This is known as a “golden cross” and is historically bullish.
Today’s price action has also seen the pair move above the falling trendline drawn from the year-to-date high at 0.9472 set in April. This now becomes the first line of support and tallies with a Fibonacci level (38.2%) of this year’s low to high move. A strong CPI print will see bulls aim for the July high at 0.9274 and above here, another Fib level (23.6%) at 0.9303.
Although Moneta Markets aims to ensure that the information/material is accurate, it cannot be held responsible for any omissions/miscalculations or mistakes as it does not warrant the accuracy of such material. Any material and/or content provided herein is intended for educational purposes only and does not constitute investment advice on how clients should trade as it does not take into consideration your personal objectives, financial circumstances or needs. Please seek independent advice before making any trading decisions. Reliance on such material is solely at your own risk and Moneta Markets cannot be held responsible for any losses resulting directly or indirectly from such reliance. Any reference to figures/statistics or numbers refers to the group of companies of Moneta Markets. Please refer to the legeal documents should you require more information.
