May 27, 2021 11:40:03
With just two exceptions, we have to go back to 1975 to find a quieter month for USD/JPY. US yields have been quiet and rangebound, which have historically been a driver of this pair and there’s been low volatility across the FX complex relative to the fireworks in commodities and the cryto space. But a rangebound market in a currency pair can mean a breakout is imminent.
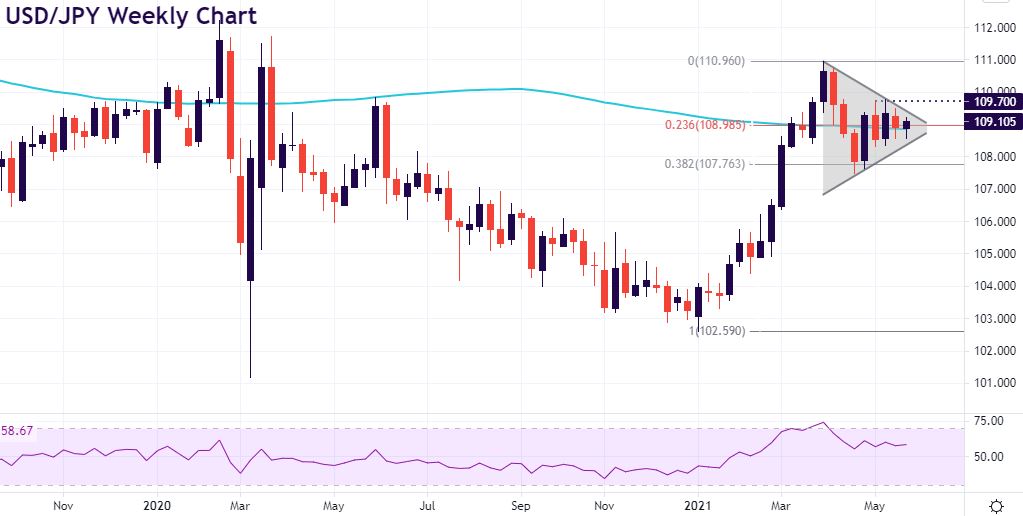
USD/JPY: Symmetrical triangle on the weekly chart
The USD/JPY weekly chart shows a symmetrical triangle is playing out with prices trading around the 23.6% Fibonacci level of this year’s high/low at 108.98 and the 200-week SMA at present. This pattern is a continuation pattern representing a period of consolidation before the price is forced to break which ordinarily is in the direction of the underlying trend.
In this case, this should mean a breakout to the upside indicating a new bullish trend so buyers can target the May high at 109.78 ahead of this year’s high at 110.96. Stops are best placed below this week’s low and the 200-day SMA at 108.55.
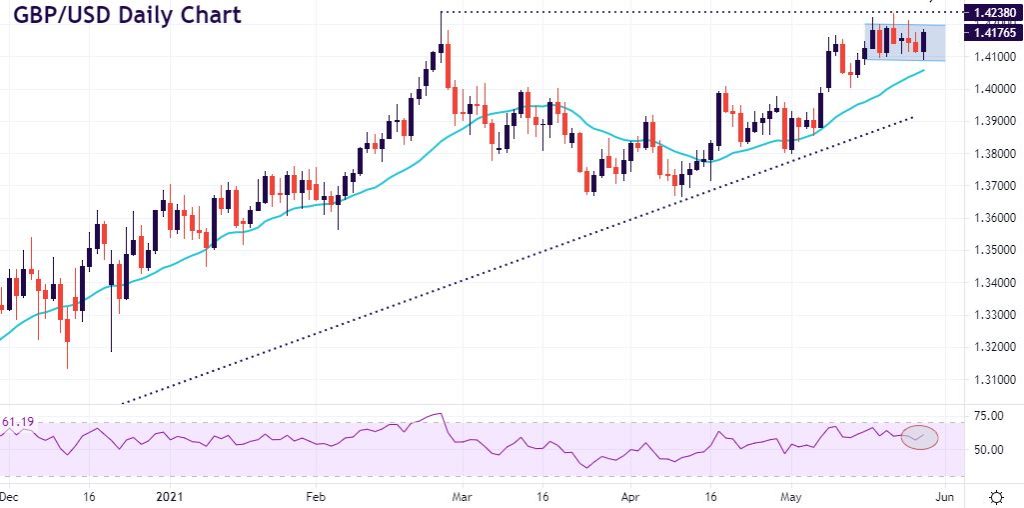
GBP/USD: Consolidating near the highs
There’s been a fair bit of domestic political noise in the UK which certainly hasn’t helped GBP recently, along with concerns about the Covid variant from India which threatened more local lockdowns. Interestingly just this morning, we’ve had an MPC member who has commented about the possibility of an early rate hike if the exit from the furlough program at the end of September is smooth. This is noteworthy as Vlieghe, although an outgoing member, is typically more dovish so this may give us a sense of where the more moderate MPC member’s outlook lies.
Cable has traded sideways for the last week or so with the range confined between 1.41 and 1.42. Sterling has jumped higher on the Vlieghe comments and again, consolidation at the highs normally can mean a break out in line with the dominant trend. The RSI dipped to 50 recently but has now picked up so bulls will aim for the February high at 1.4241 with an eye on the April 2018 high at 1.4376. Support lies at 1.4100/15.
Although Moneta Markets aims to ensure that the information/material is accurate, it cannot be held responsible for any omissions/miscalculations or mistakes as it does not warrant the accuracy of such material. Any material and/or content provided herein is intended for educational purposes only and does not constitute investment advice on how clients should trade as it does not take into consideration your personal objectives, financial circumstances or needs. Please seek independent advice before making any trading decisions. Reliance on such material is solely at your own risk and Moneta Markets cannot be held responsible for any losses resulting directly or indirectly from such reliance. Any reference to figures/statistics or numbers refers to the group of companies of Moneta Markets. Please refer to the legeal documents should you require more information.
