May 4, 2021 14:25:44
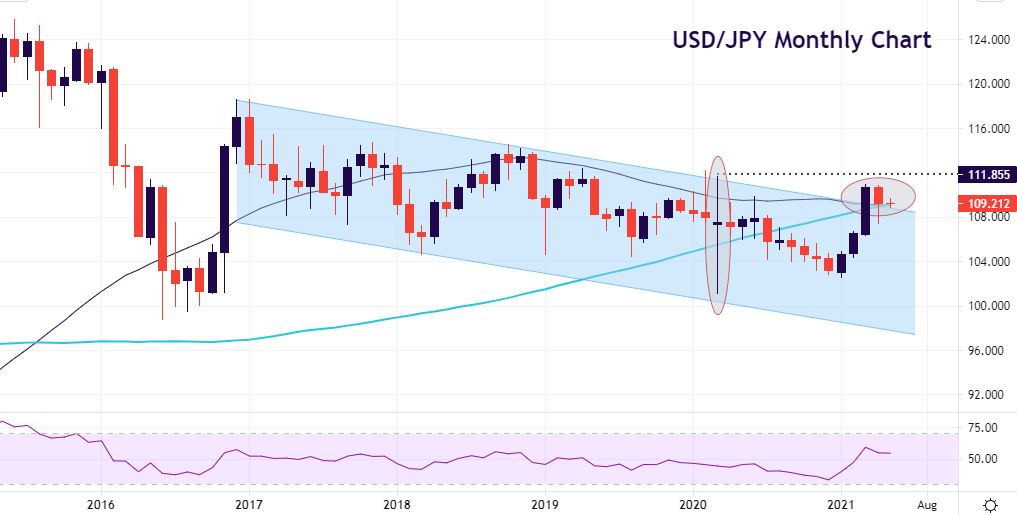
The monthly USD/JPY chart shows us that the pair has been trading in a shallow bearish channel since the highs in December 2016 at 118.66. The following month saw near identical highs, but since then prices have slowly drifted lower in a declining channel. The March 2020 doji touching both the top and bottom of the channel is noteworthy and encapsulates well the volatility at the start of the pandemic.
Since the beginning of this year, prices have moved higher as US bond yields have pushed up and USD/JPY moved through the top of the channel in March and April. We are now trading around the 50-month and 100-month SMA with a crossover potentially showing a change in trend. If prices turn lower, then the channel is working as resistance as it has done previously and prices will fall back to mid-range. However, the RSI is not overbought and momentum is not overly bullish so there are reasons to note if the pair does break to the upside.
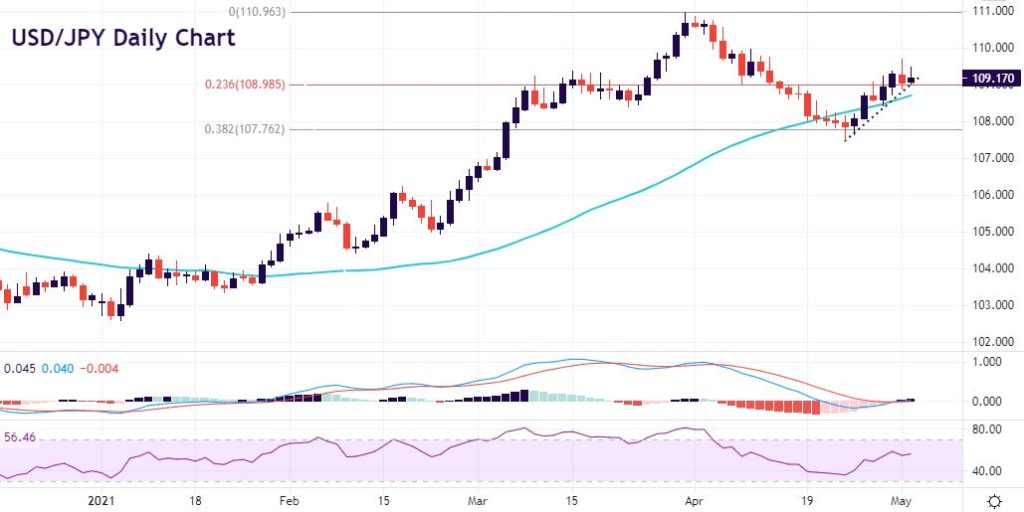
Meanwhile on the daily USD/JPY chart, the pair found support around 107.76 (38.2% Fib level) last month and is currently trading just above the 23.6% Fib level at 108.98. Rising trendline support continues to back a bullish bias so support at the current Fib level is key. If this fails, next support below here comes in at 108.73 while bulls will try and break higher to push for 110 and cycle highs beyond.
Although Moneta Markets aims to ensure that the information/material is accurate, it cannot be held responsible for any omissions/miscalculations or mistakes as it does not warrant the accuracy of such material. Any material and/or content provided herein is intended for educational purposes only and does not constitute investment advice on how clients should trade as it does not take into consideration your personal objectives, financial circumstances or needs. Please seek independent advice before making any trading decisions. Reliance on such material is solely at your own risk and Moneta Markets cannot be held responsible for any losses resulting directly or indirectly from such reliance. Any reference to figures/statistics or numbers refers to the group of companies of Moneta Markets. Please refer to the legeal documents should you require more information.
