October 20, 2021 11:54:49
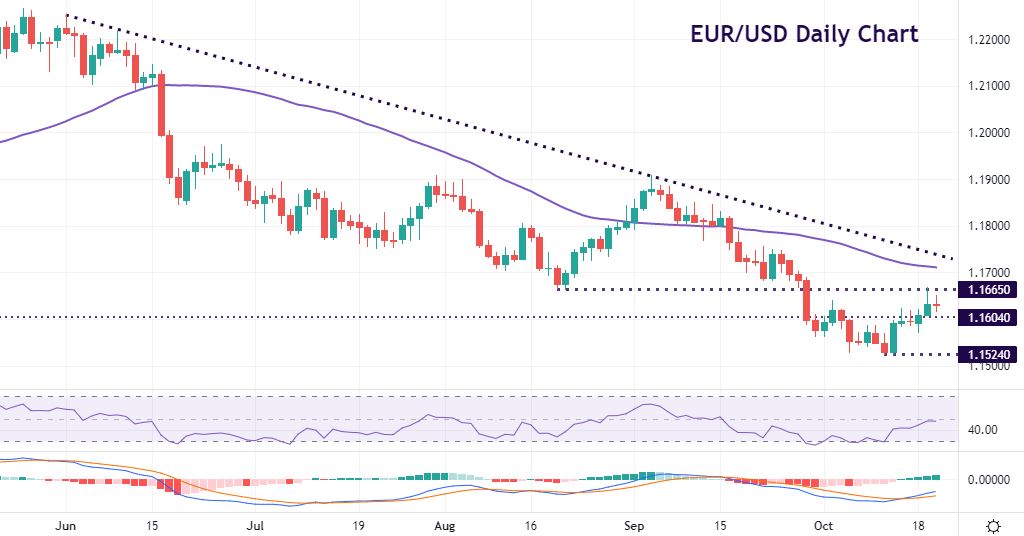
EUR/USD long-term downtrend still intact
With the dollar on the defensive this week, the EUR rally yesterday extended to resistance at the August low at 1.1665. However, that barrier proved too much, at least at the first attempt. The late September breakdown through this level had spurred the recent drop to the low 1.15s so is a key area for bulls to break and bears to defend.
This move higher has eased oversold conditions with the daily RSI back towards the 50 level and midrange. Sellers will need to push lower through 1.1620 and then 1.1604 to confirm a short-term top is in. A break above 1.1665 will see prices rise to 1.17 and the 50-day SMA at 1.1710. Long-term trendline resistance looms just above here around 1.1726.
Eurozone PMIs due Friday are expected to fall after hitting a 15-year high in July. Economists are looking for any signs that labour and supply shortages may show up in the data. This would point to growing price pressures which could soften demand going forward. We might also see the first impact of the gas crisis hitting manufacturing.
Two senior ECB policymakers have both recently reiterated the bank’s dovish policy outlook. It seems that the “low for longer” policy stance remains, even though the energy-importing region may suffer through the energy supply crisis and increased risks to inflation.
USD/CHF undecided below recent highs
This major has got a bit messy since failing to break decisively above 0.9300 on several occasions over the last few weeks. That level was also capped by long-term trendline resistance from the 2019 May high.
Prices have now moved below the near-term up trendline and the July high at 0.9274. The 50-day SMA is acting as support with a few two-way long-tailed days seen in the last few sessions. This is where prices have moved both higher and lower quite sharply but have then closed near the previous day.
If we lose the 50-day SMA, we might be exposed to a deeper corrective selloff. The 200-day SMA sits at 0.9139. Bulls will want to push above 0.9274 and then 0.93 to test the 0.9368 September peak again.

Although Moneta Markets aims to ensure that the information/material is accurate, it cannot be held responsible for any omissions/miscalculations or mistakes as it does not warrant the accuracy of such material. Any material and/or content provided herein is intended for educational purposes only and does not constitute investment advice on how clients should trade as it does not take into consideration your personal objectives, financial circumstances or needs. Please seek independent advice before making any trading decisions. Reliance on such material is solely at your own risk and Moneta Markets cannot be held responsible for any losses resulting directly or indirectly from such reliance. Any reference to figures/statistics or numbers refers to the group of companies of Moneta Markets. Please refer to the legeal documents should you require more information.
