August 5, 2021 13:35:13
AUD/CAD downtrend moderates
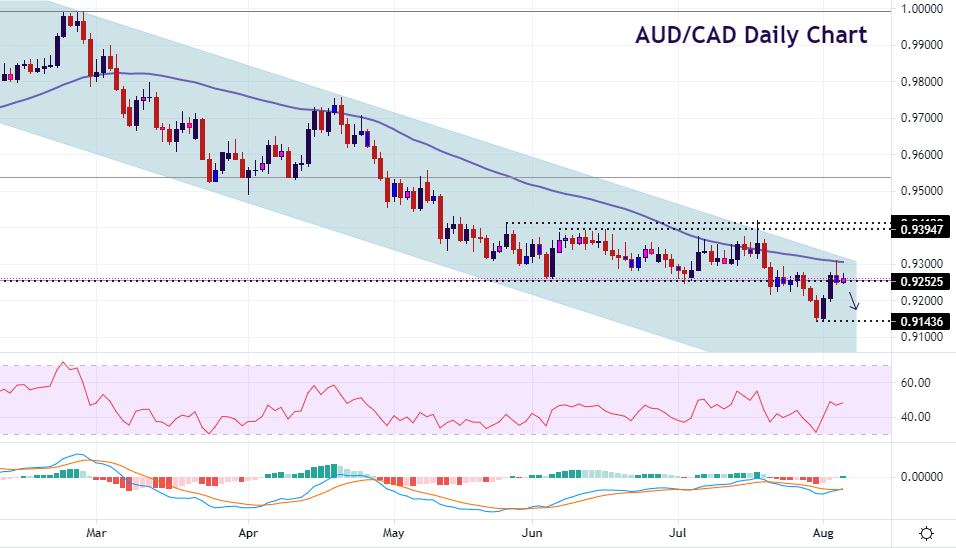
Since topping out in late February just below the key psychological 1.00 level, AUD/CAD fell in a bearish channel. The pair then tracked sideways in a range between 0.9260 and 0.9380, more or less, since mid-May until late July, held up by a long-term Fib level at the bottom part of the range. Long-term bearish momentum then resumed with prices dropping below 0.92.
This down move pushed short-term indicators into oversold territory and the pair has bounced quite strongly back to the lower part of the recent range which now acts as resistance to further upside at 0.9250/60.
Weekly oscillators remain firmly bearish even though shorter-term indicators have moderated. Yesterday’s price action also warns that sellers are still in control with a bearish pin bar failing at the 50-day SMA. First target for the bears is last week’s cycle low at 0.9144/45 with the 50% retrace level of the March 2020 to Febarury 2021 gains at 0.9031 further out. Stops can be placed at the spike high from yesterday above 0.9311. The weekly close is key here as more AUD strength may point to upside risk and a false breakdown on the weekly chart.
GBP/AUD pauses in solid uptrend
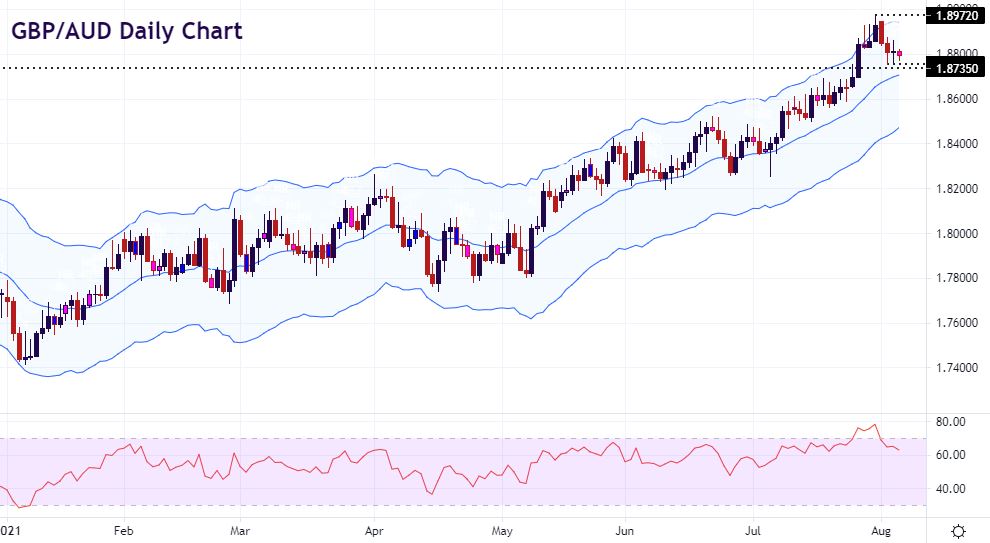
This pair bottomed out with a spike low last December and the January low at 1.7415. GBP/AUD then tracked sideways between 1.78 and 1.80 before bullish momentum picked up from mid-May in a rising channel. The daily RSI entered overbought territory on the bullish burst in later July and prices touched the upper Keltner band too, signalling that a pullback was near.
Since the high last week at 1.8972, the pair has retraced just short of a key Fib level at 1.8735. We printed an “inside day” yesterday and it looks like we might do so again today. This candlestick occurs when one trading day’s high and low falls within the range of the prior days’ highs and lows. While recognised as a neutral sign, the long-term uptrend is still strong so bulls should go hunting for the cycle highs again with stops below this week’s low at 1.8756.
Although Moneta Markets aims to ensure that the information/material is accurate, it cannot be held responsible for any omissions/miscalculations or mistakes as it does not warrant the accuracy of such material. Any material and/or content provided herein is intended for educational purposes only and does not constitute investment advice on how clients should trade as it does not take into consideration your personal objectives, financial circumstances or needs. Please seek independent advice before making any trading decisions. Reliance on such material is solely at your own risk and Moneta Markets cannot be held responsible for any losses resulting directly or indirectly from such reliance. Any reference to figures/statistics or numbers refers to the group of companies of Moneta Markets. Please refer to the legeal documents should you require more information.
