June 14, 2021 15:36:01
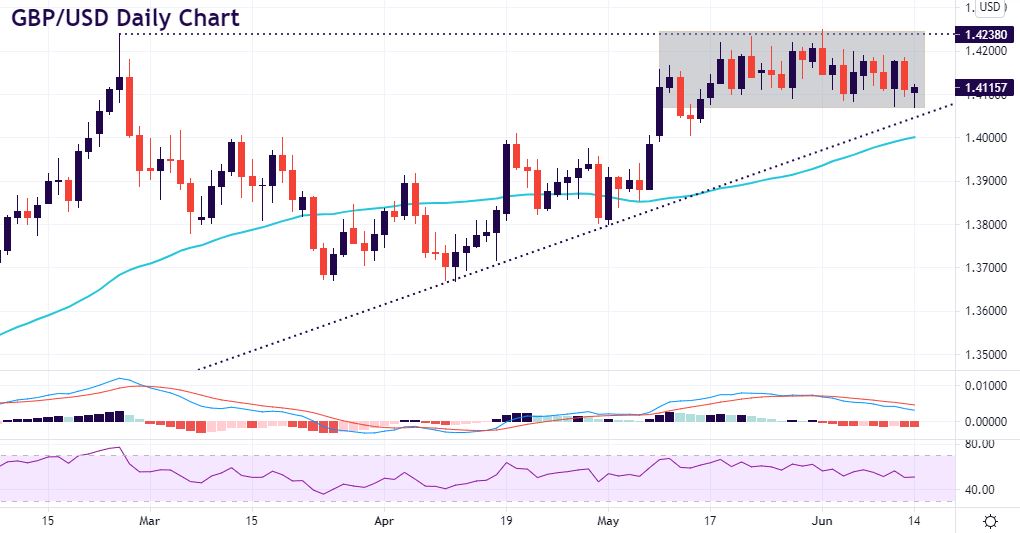
GBP/USD oscillating sideways
The more a currency pair tracks sideways, the more the breakout will be large and we get range expansion, often in line with the existing long-term trend. Cable has been trapped in a 1.41-1.42 range more or less for roughly four weeks and is marginally weaker today with the UK’s four-week delay to the grand reopening well-telegraphed. With most major businesses already open, the effect should only concern the headline writers. Buy the rumour, sell the fact? (or sell rumour, buy the fact in this case…)
The Fed meeting on Wednesday will have a major sway on where cable goes with any hawkish hints / more prominent taper talk pushing the pair lower and through the potential recent range bottom below 1.41. EU talks too could have an impact with the UK seemingly playing hard ball. Consolidation trading has not touched the upper part of the range since the start of June, while a series of moves under 1.41 potentially make a move lower more likely. Today’s low and last week’s low sits around 1.4074/70 with the upward trendline around 1.4050. The 50-day SMA is then below here at 1.4005 as next support. Resistance after 1.41 comes in at the mid-figure area before the top of the range and June high of 1.4250.
EUR/USD holding above 1.21
The short squeeze on Friday saw the world’s most popular currency pair fall below 1.21 and today saw a similar move before buyers stepped in to push prices above this important level. A Fib level (61.8%) of the January to March decline sits around here plus last week’s low plus the 50-day SMA at 1.2096. Any fresh FOMC language on tapering will push the pair lower to next support at the 100-day SMA at 1.2043 with the 200-day SMA just below 1.20. Resistance stands at the next Fib level at 1.2211 and last week’s high at 1.2218.

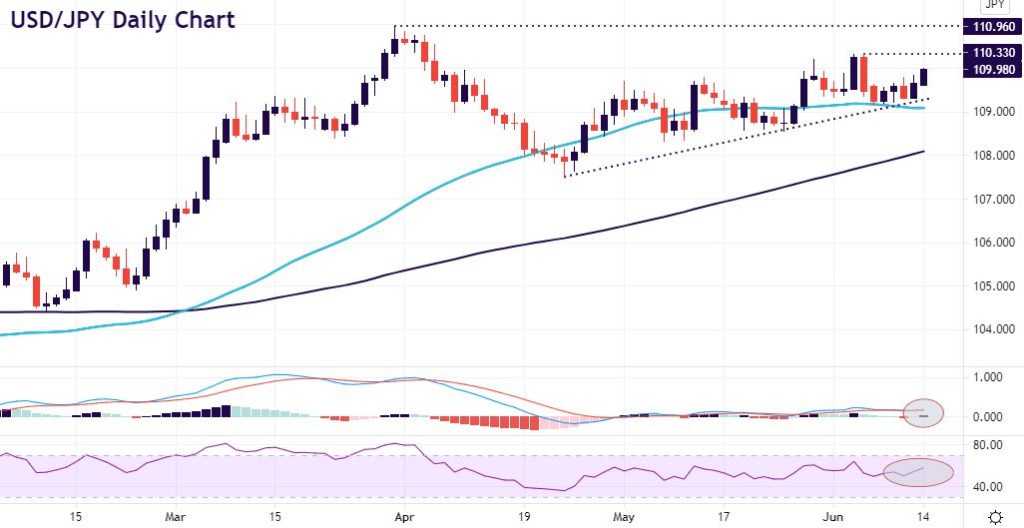
USD/JPY pointing up
Having flirted with the upward trendline over the past few trading sessions, USD/JPY has picked up bullish momentum today with the RSI and MACD strengthening. That trendline from the April low has offered good support and bulls would clearly like a close above 110 in order to push further north towards early June highs around 110.32 and further out to the year-to-date high at 110.96. Support lies at the upward trendline around 109.30 and then the 50-day SMA at 109.09.
Although Moneta Markets aims to ensure that the information/material is accurate, it cannot be held responsible for any omissions/miscalculations or mistakes as it does not warrant the accuracy of such material. Any material and/or content provided herein is intended for educational purposes only and does not constitute investment advice on how clients should trade as it does not take into consideration your personal objectives, financial circumstances or needs. Please seek independent advice before making any trading decisions. Reliance on such material is solely at your own risk and Moneta Markets cannot be held responsible for any losses resulting directly or indirectly from such reliance. Any reference to figures/statistics or numbers refers to the group of companies of Moneta Markets. Please refer to the legeal documents should you require more information.
