December 31, 2021 8:20:10
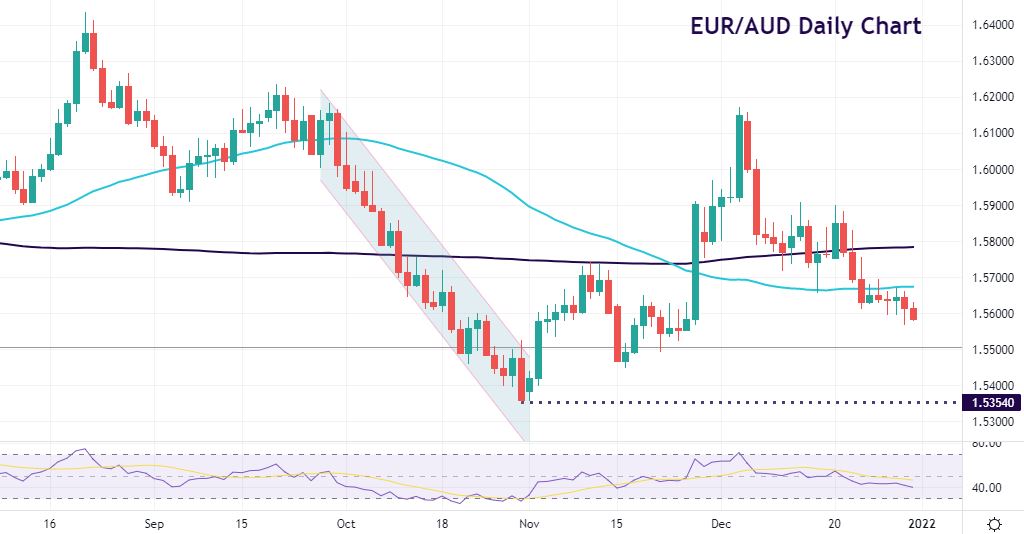
EUR/AUD losing near-term support
This pair has had quite a ride in recent months. The steep descending bear channel during October posted a multi-month low at 1.5354. But the long-term bottoms from February and March at 1.5252/70 held.
Bullish divergence was seen on the daily RSI. The RSI is a useful way of looking at how fast a pair has been moving. A low RSI suggests a currency pair is oversold and prices hadn’t been in this state since February earlier in the year. Bullish divergence is where a new low in price is printed but not a new low in the RSI, indicating that the pair should move higher.
The emergence of Omicron saw a strong bid and prices rebounded to a spike high at 1.6170. Overbought conditions in the RSI then eased. Most recently, the pair has tracked sideways after breaking below the 200-day SMA at 1.5785. We are now trading under the 50-day SMA at 1.5675 which acts as resistance. With the RSI pointing lower, bears will target at Fib level at 1.5506 and then the cycle low at 1.5354.
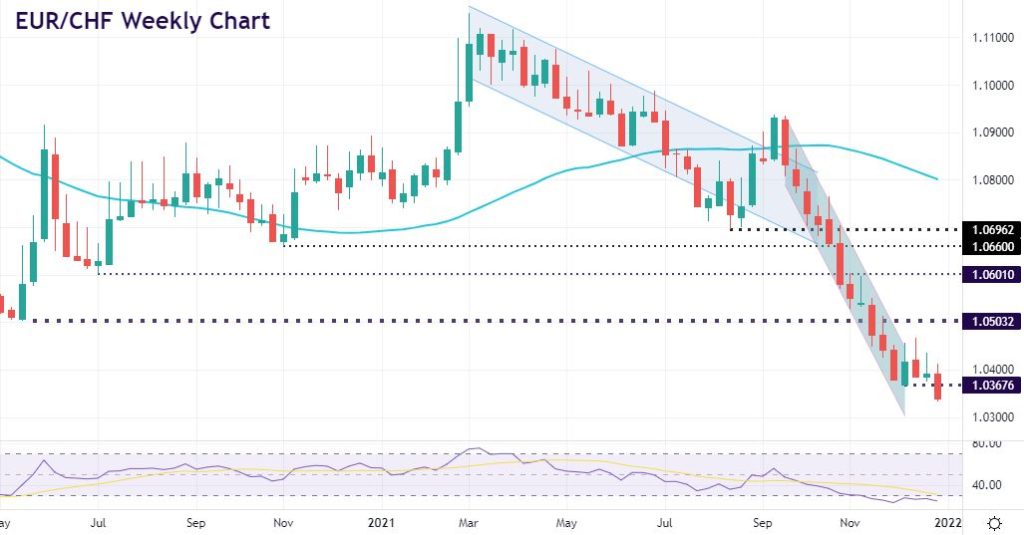
EUR/CHF makes new long-term low
EUR/CHF is often subject to SNB intervention. This has historically meant the central bank tries to curb CHF appreciation by buying the pair. But the many “lines in the sand” over the past several months which the SNB supposedly set have not really come to pass. One European bank has dubbed the franc “the quintessential risk hedge to European risk”, which has certainly made it appealing when you consider the Omicron infection rates and restrictions in activity.
The longer-term weekly chart is a good way to see the awesome downtrends in this pair. Two bearish descending channels are obvious with the first one starting at the beginning of March above 1.11. A rebound in August around 1.07 took place with much speculation that the SNB were trying to defend this level. Prices got to 1.09 before falling in another series of lower highs and lower lows through notable support levels.
The May 2020 low at 1.0503 was broken in November and then the recent trough at 1.0367 was pierced yesterday. Long-term lows from April 2015 sit at 1.0233 and then a Fib level at 1.0155. After a break of another key support level yesterday, we are deeply oversold. This means we may see some consolidation before the long-term downtrend reasserts itself again if we hold below 1.0367.
Although Moneta Markets aims to ensure that the information/material is accurate, it cannot be held responsible for any omissions/miscalculations or mistakes as it does not warrant the accuracy of such material. Any material and/or content provided herein is intended for educational purposes only and does not constitute investment advice on how clients should trade as it does not take into consideration your personal objectives, financial circumstances or needs. Please seek independent advice before making any trading decisions. Reliance on such material is solely at your own risk and Moneta Markets cannot be held responsible for any losses resulting directly or indirectly from such reliance. Any reference to figures/statistics or numbers refers to the group of companies of Moneta Markets. Please refer to the legeal documents should you require more information.
