August 30, 2021 15:40:19
After major risk events, it always pays to step back and look at longer timeframe charts to see how meaningful price action is and where prices could head over the long-term. Using timeframe analysis also then potentially shows us more meaningful price patterns.
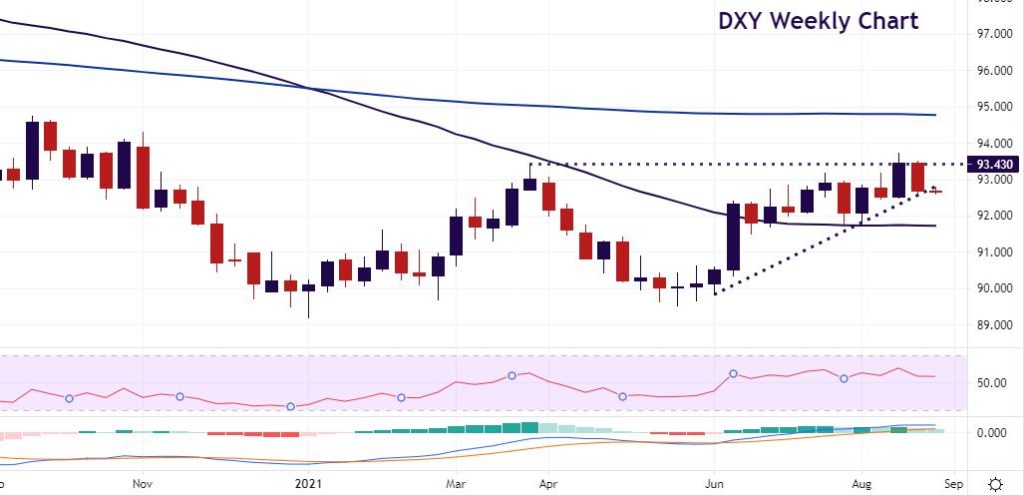
We can see the weekly DXY chart printed dark cloud cover after Fed Chair Powell’s dovish speech on Friday. This reversal pattern is where a down candle opens above the close of a prior up candle and then closes below the midpoint of the up candle. This can be significant as it shows a shift in momentum from the upside to the downside.
Both candles are relatively large which shows strong participation by traders and means the pattern is typically more meaningful. The pattern has also occurred after a bullish uptrend so ticks another box for dark cloud cover. Key to this pattern going forward is to see if this week’s candle also shows falling prices. A further price decline following last week’s bearish candle usually confirms the pattern.
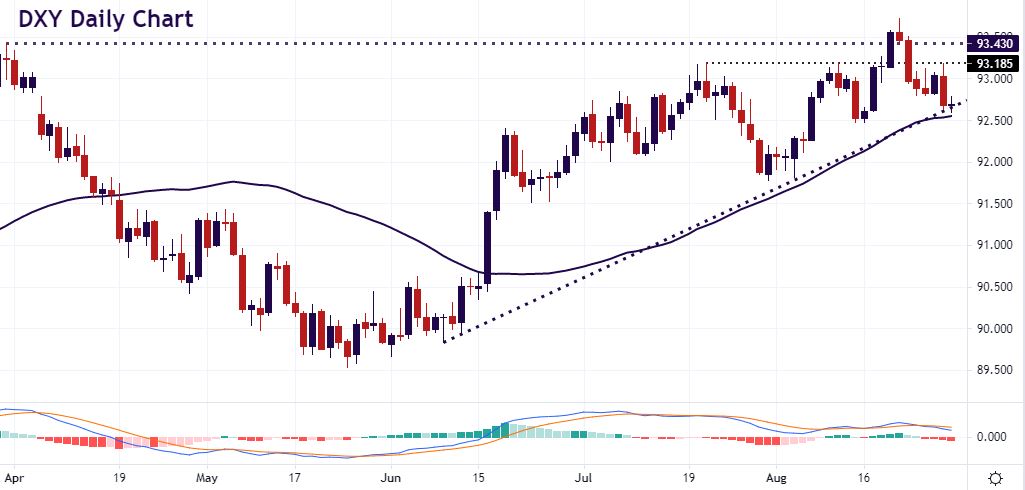
The daily DXY chart shows that a bearish outside reversal day candle printed on Friday. This daily price action had a higher high and a lower low than the previous day. The two price bars are moving in opposite directions, hence it is a reversal signal. It is also notable that Friday’s candlestick, the second bar, has a longer body, that is the difference between the open and close. This shows greater conviction on the part of the sellers.
After making new highs a couple of weeks ago at 93.72, prices have failed to stay above the previous cycle high at 93.43. Bearish momentum has taken the index to trend support from the June lows and we currently trade at 92.67, just above the 50-day SMA. A strong breakdown here, in line with the bearish candles will challenge mid-August lows at 92.47/8 and then 91.78 which is the month low from earlier in August. If trendline support holds, the 93.19 zone offers first resistance where prices failed last week and on several other occasions over the last few weeks.
Although Moneta Markets aims to ensure that the information/material is accurate, it cannot be held responsible for any omissions/miscalculations or mistakes as it does not warrant the accuracy of such material. Any material and/or content provided herein is intended for educational purposes only and does not constitute investment advice on how clients should trade as it does not take into consideration your personal objectives, financial circumstances or needs. Please seek independent advice before making any trading decisions. Reliance on such material is solely at your own risk and Moneta Markets cannot be held responsible for any losses resulting directly or indirectly from such reliance. Any reference to figures/statistics or numbers refers to the group of companies of Moneta Markets. Please refer to the legeal documents should you require more information.
