May 31, 2021 13:31:13
There’s not a lot expected from the RBA meeting overnight as the bank keep its policy measures unchanged. Frist quarter GDP figures get released on Wednesday but we’ve haven’t received much data since the last policy meeting at the start of May. Weak inflation numbers and a slowdown in total employment, albeit with a drop in the unemployment rate due to a smaller participation rate have presented a mixed picture. A fourth lockdown in Melbourne will probably also mean the RBA sticks to its dovish guns. As economies open up round the world, the bank will be aware that the domestic recovery should get better, with terms of trade improving, but we are still a way off that point.
The RBA did signal in their May minutes that they would make a decision on the next stage of their QE and bond yield control programme (YCC) at their July meeting. So, guidance and the bulk of any moves will be saved for then, with this meeting more of a holding event. That said, any surprise could follow in the RBNZ and Bank of Canada steps and gives us a more hawkish bias as the RBA looks to a stronger domestic recovery.
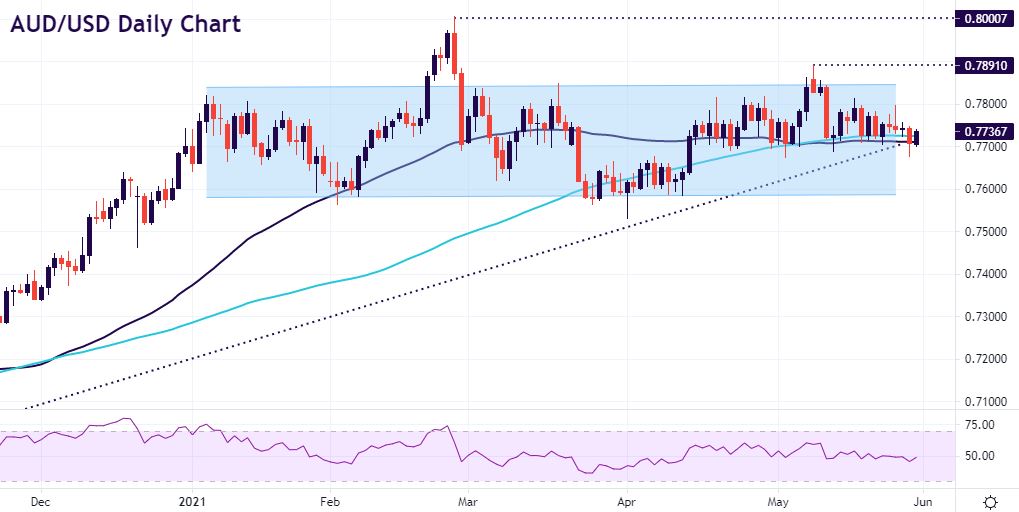
AUD/USD waiting for a catalyst
AUD/USD has tracked sideways around 0.77 for some months now, sitting on the 50-day and 100-day moving average over the last few weeks with the economy buffeted by competing forces. We are also trading just around the bullish trendline from last year’s May lows, but momentum indicators are very uninspired with the RSI at 50. A positive outlook by the RBA will see the bulls take charge and push the pair to the top of the range near this month’s high at 0.7891. If the meeting is simply marking time, the market will wait for the US jobs data to see if the pair can find some direction.
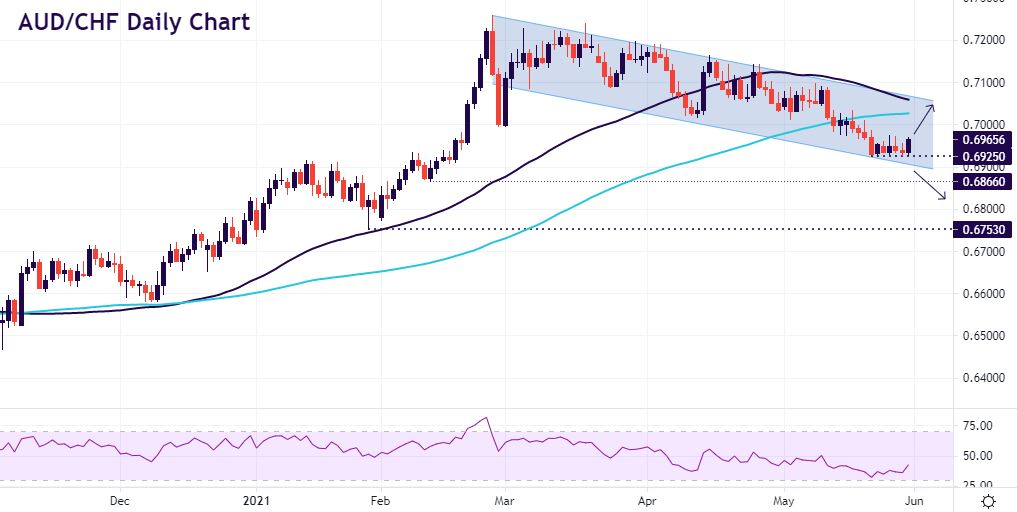
AUD/CHF on a cliff
AUD/CHF’s uptrend from the pandemic lows last year looks to have reversed since making a cycle high at the end of February at 0.7260. Since then, the pair has moved in a shallow descending channel with a series of lower highs and lows. Interestingly on a longer-term monthly and weekly chart, this could be a bullish flag where prices sit at the bottom of the pattern and are waiting to move higher as daily upward momentum picks up.
But on the daily chart, and with prices below both the 50-day and 100-day SMA, the recent low at 0.6925 is key in holding the bears at bay. If this support fails, the pair can move quickly down to 0.6753 with 0.6866 offering minor support initially.
Although Moneta Markets aims to ensure that the information/material is accurate, it cannot be held responsible for any omissions/miscalculations or mistakes as it does not warrant the accuracy of such material. Any material and/or content provided herein is intended for educational purposes only and does not constitute investment advice on how clients should trade as it does not take into consideration your personal objectives, financial circumstances or needs. Please seek independent advice before making any trading decisions. Reliance on such material is solely at your own risk and Moneta Markets cannot be held responsible for any losses resulting directly or indirectly from such reliance. Any reference to figures/statistics or numbers refers to the group of companies of Moneta Markets. Please refer to the legeal documents should you require more information.
